

THE TABLEAU SOFTWARE
THE TABLEAU SOFTWARE
Tableau software is an American based company which provides a platform for companies to visualise data. Found in the year 2003 by Christian Chabot, Pat Hanrahan, Chris Stolte, and Andrew Beers in California, the company aimed to create a platform where data can be visualized through the use of various types of graphs that help in interpreting and analysing the data. The company was taken over by Salesforce for the price of 15.7 billion in the year 2019. The headquarters are currently in Seattle, Washington. Tableau is a platform that helps people bring together data and creatively analyse them in the form of various graphs.
Data is high in demand in today’s market, it can be said that the market is very data driven. Just acquiring data is not enough to understand it and use to our needs, the data needs to be processed and portrayed in a way that is understandable. Tableau helps organizations and other people to organise their data with a platform that uses modern analytic techniques to bring the data together in a way that makes sense. The reason tableau is a market leading choice is that they offer innovation with respect to the customer’s needs. The platform is able to transform any type of data into actionable comprehensions in a quick and effective manner.
The matter of creating quick, effective, and understandable graphs is just dragging and dropping the components one wants an analysis in the panel. The tableau software offers its customers a 14 days free-trial period to try out the software before they have to buy the subscription. The software offers a range of descriptive videos which exhibit various functions which can be done using the tableau platform. The tutorial videos help new users to get a hang of the functions available in the software and how to utilize them effectively. The tableau platform has very many satisfied customers accounting to one million which spans over a wide range of 500 groups of users around the world. The tableau platform also has an active forum for their community which hosts various programs.
The community at tableau is wide, diverse, active, and supportive. The members can share connections, support other members, and share their experiences with others in the community. The customers have the opportunity to help in adding to the platform by suggesting their requirements. The tableau team takes into consideration the requirements of the customer and offers features which are impactful as opposed to trendy. At tableau, the data is the main component. It is a data driven platform which allows the customers to innovate and transform their data.
There are many built in visuals that allow the users to have the best visual practice and endless exploration of data while analysing the flow of the data. Tableau allows the users to import datasets or explore the various datasets that are available for use inside the software. The software allows the analysis of data live or offline. Live data is changing and refreshes when the data refreshes, but the user can take the data offline and work on it too. The graphs for the data can be drawn using excel sheets too but the tableau software allows the users to manipulate the graphs to depict what they want in the graph and change it in a very easy manner while offering many suggestions for the type of graph that can be used to best represent the data. The software allows users to obtain calculations from the data easily as they have many in built calculation methods.
The tableau software allows the user to connect to various servers like Oracle, MySQL, Amazon Redshift and many more or the user can import any type of file like text, JSON, Excel, and so on which contain the data to be interpreted into the software. The user can link two or more tables or datasets and create graphs depicting their union by choosing which columns to be represented in the union. This feature allows users to interpret relations between data of similar tables. The software requires the users to just drag and drop the fields that need to be interpreted into graph form and the software does the rest. The software allows the users to depict the graphs in various colour patterns, size patterns, add fields as labels, and show some fields as tooltips or details. The software also allows the users to add filters to process the data. The tableau platform has the option to predict various analysis like trend lines, forecast, grand totals, row, totals, and column totals.
An example is easier to understand and show the results of the performance of the tableau software. For the example, a dataset is taken about the sales of a supermarket company which has recorded sales for three months in three different branches.
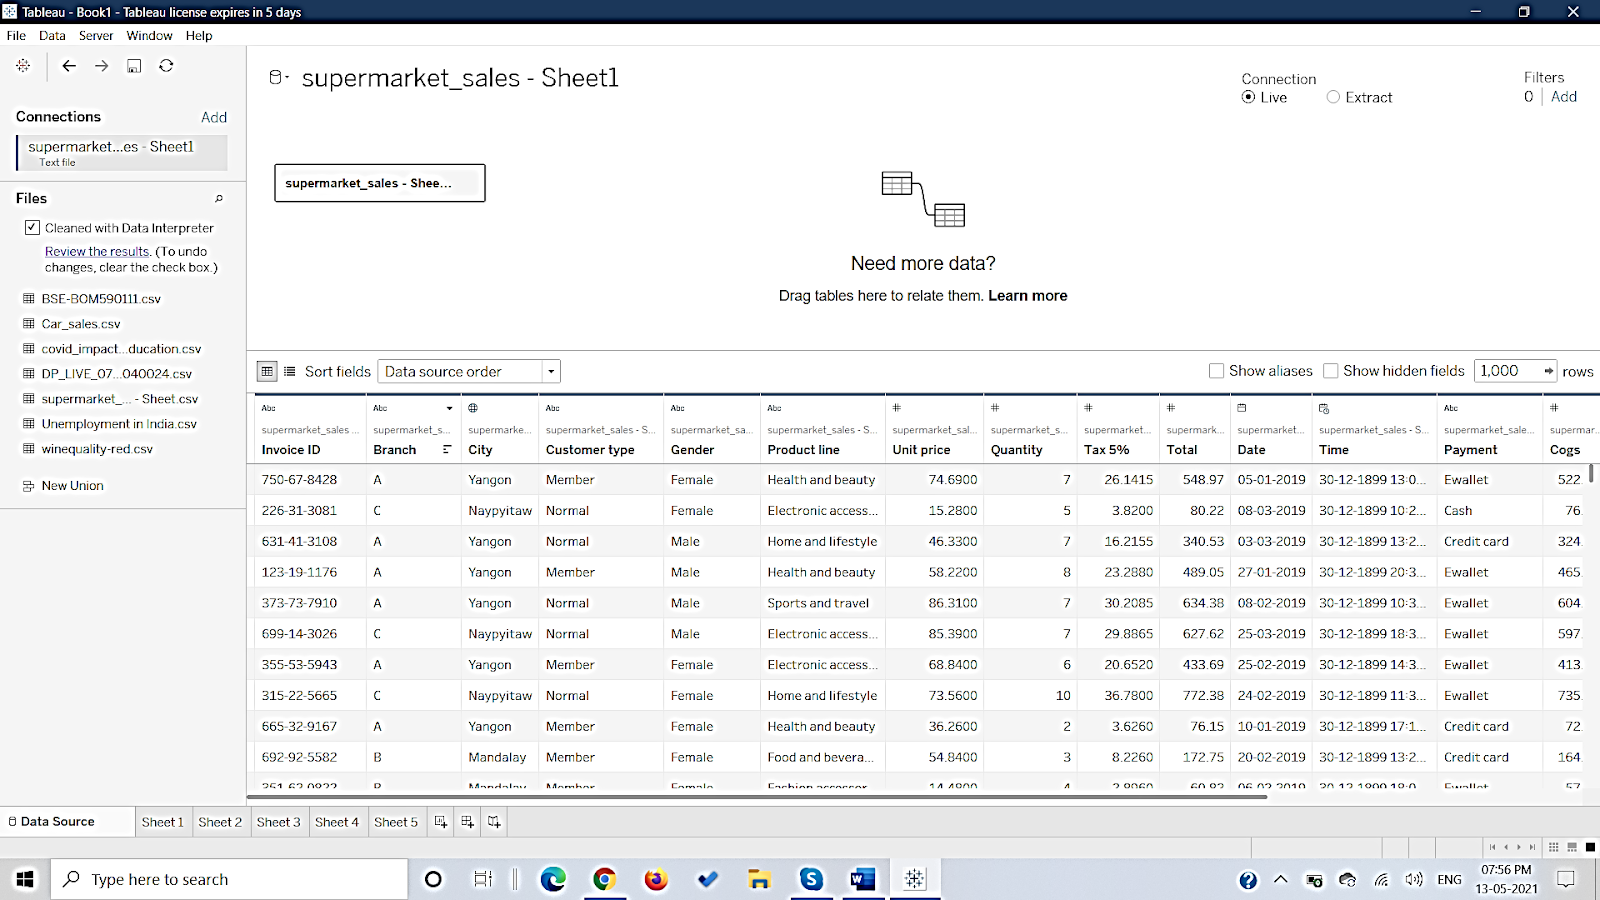
Fig.1: The dataset of the supermarket sales
Source: Kaggle.com
Now with the help of tableau we can analyse the data to obtain various graphs depicting various analyses performed on the data. The first graph shown in Fig.2 shows the gross income of the three branches in the year 2019.
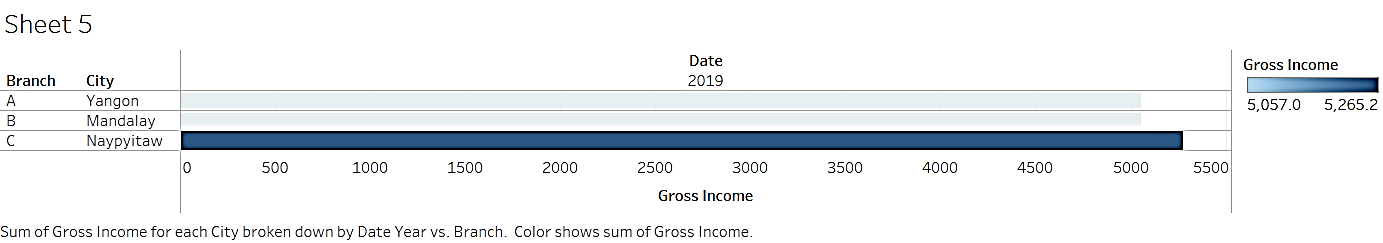
Fig.2: Graph showing the gross income of the three branches for the year 2019
The sales of the branch C, which is located in the city Naypyitaw, Myanmar has an income of 5265.2 which is slightly higher(3.8%) than the remaining two branches which have the same gross income of 5057. The income of the supermarket mainly relies on the location of the store. As Naypyitaw is the capital city of Myanmar, the sales of the supermarket are slightly higher than the two other branches.
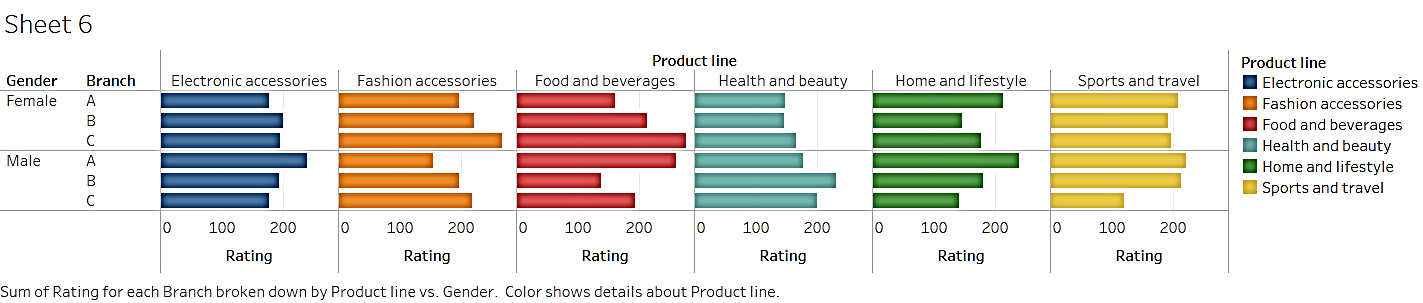
Fig.3: The graph shows the sale of various products in different categories according to the gender and branch
The graph shown in Fig.3 depicts the rating of various products under the categories of electronics, fashion, food and beverage, health and lifestyle, and sports and travel according to the branch and gender. The graph analysis shows that the location of the branch and the gender of the customer depends on the sale of the product in the various categories, the higher the sales of the product, the higher its rating. The sale of a product depends on the gender of the customer buying it as well. According to the graph, male customers are mainly attracted toward categories like electronic accessories, sports and travel, health and beauty, and home and lifestyle. Whereas the female customers are more attracted to categories like fashion, home and lifestyle, food and beverages, and electronic accessories. Here again the location of the store plays a role in deciding the rating of the product. This allows the user to note that the customer’s preferences vary according to the place they live in.
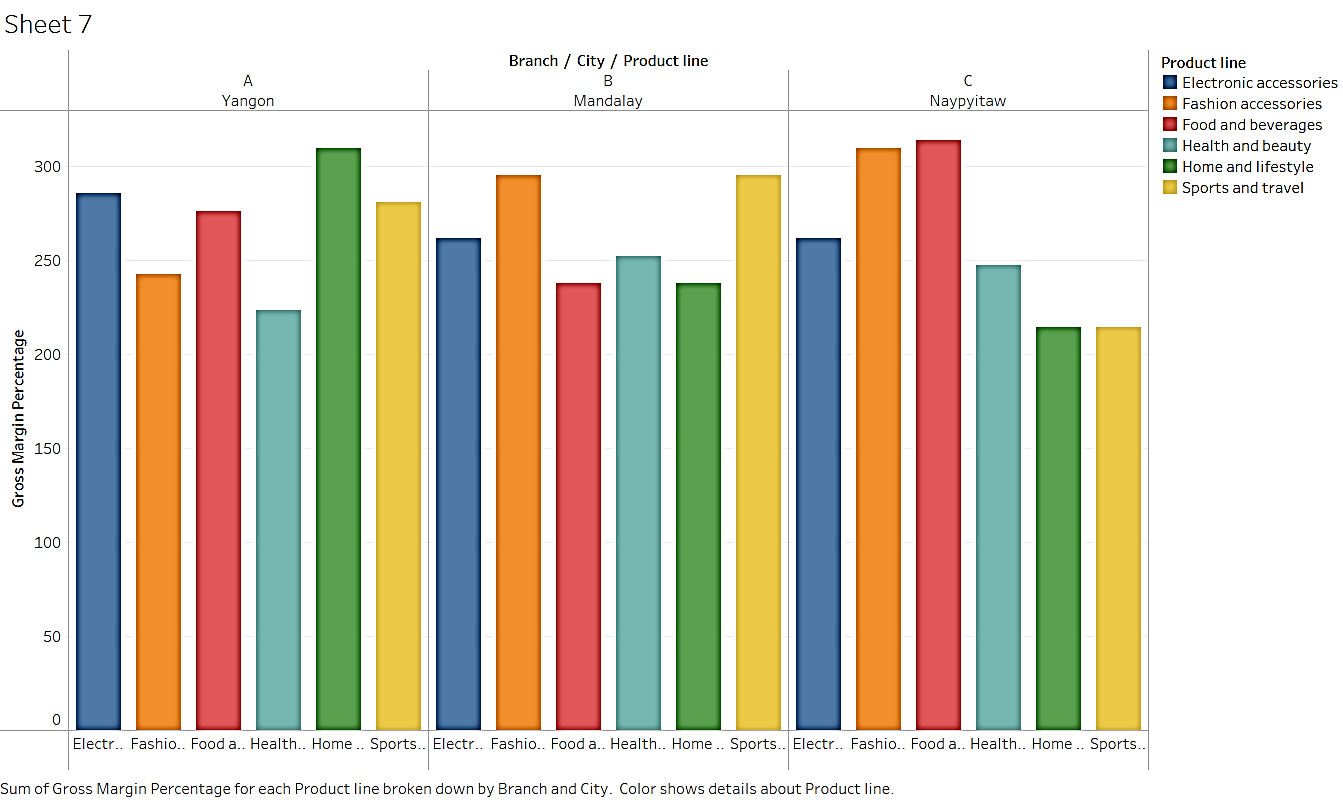
Fig.4: A graph which depicts the impact of the product line on the gross sales of the supermarket.
The graph shown in Fig.4 depicts the impact the various products have on the gross sales of the supermarket. In lieu of the location of the store, the products sold by the supermarket also has an impact on the gross sales. According to the graph, the various product types have various levels of impact on the gross sales of the store. The supermarket needs to analyse the trends of the product sales in the area of the store to achieve more sales. For example; in branch A, the home and lifestyle section have more sales when compared to the other two branches, B and C. The profits of branch B are slightly lesser than that of branches C and A. They have more sales in the categories of fashion and sports. If they endorse the other categories more or offer sales and discounts on the products in the other categories to boost their sales, the branch B might experience a profit on all the categories rather than only the two. Similarly in branch C, they have more sales in two categories namely fashion and food, and very less sales in the other categories in comparison. A similar trend is seen in the branch A but there are only two categories which are slightly lacking in sales in comparison. The use of discounts and sales attract customers and increase the sales of products in various categories.
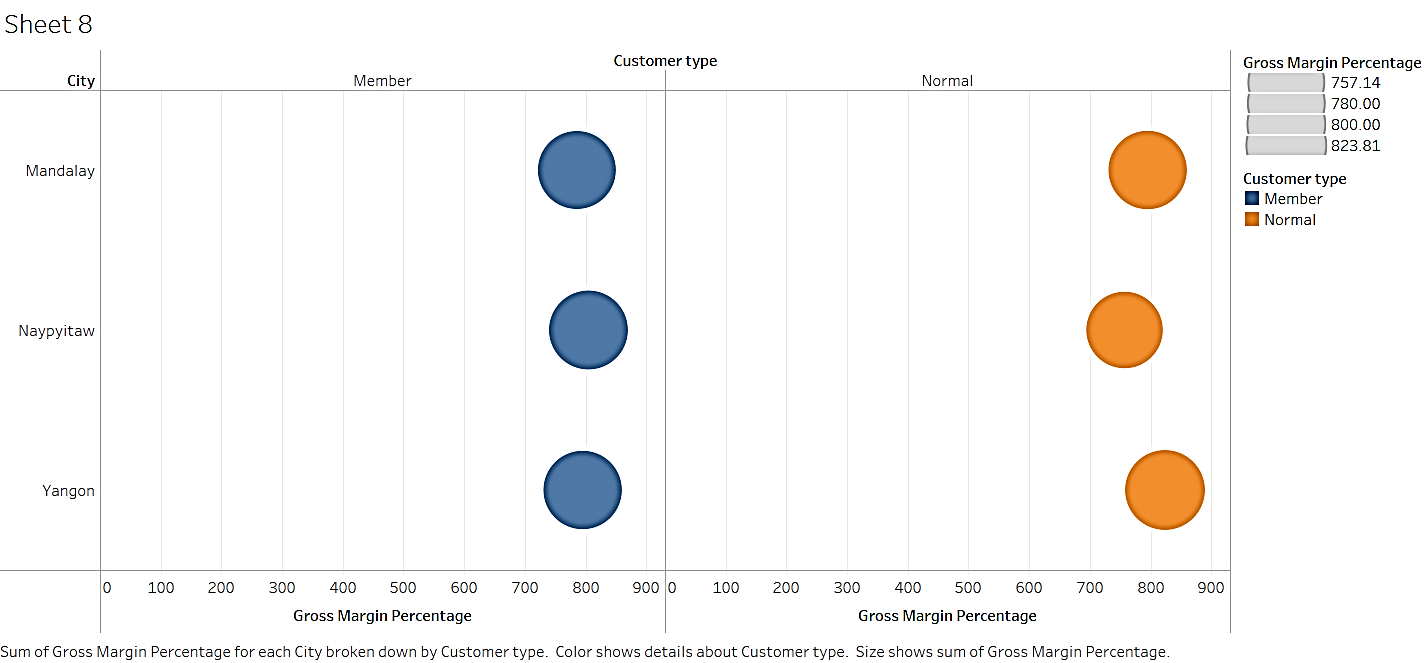
Fig.5: A graph depicting the impact of the type of customer has on the goss sales margin.
The graph in Fig.5 shows the impact the type of customer, ie a member and a nornal customer have on sales. Supermarkets usually offer various benefits to their members. The benefits may be points to collect and receive prizes, offers that normal shopers may not receive, special discounts, vouchers, or early access to limited edition sales. They charge a nominal fee to the customer to upgrade them to a member. With the benefits and prizes they receive, members tend to shop more and offer more income to the store than normal shopers. As can be seen in the graph, the members contribute more to the sales and receive more in return through the points they earned.
Although only a few analyses are depicted taking the example, the tableau software helps the users manipulate how they want to display the data in the graphical format. The same dataset can be manipulated in various ways to depict various graphs which show various results. The tableau software easily allows the users to save their work by creating workbooks that store in the device that the software is installed. This way the users are able to modify the graphs anytime they wish, and access it easily too.