

DATA MINING
DATA MINING
The process of turning raw data into useful information is data mining. Data mining uses software to search for certain patterns in large batches of data useful data can be extracted from raw data. Businesses use data mining to create efficient marketing strategies, decrease the cost, and increase the sale of their products. The processes in data mining are used to create models in machine learning. Data mining is a method of exploring raw data to find trends in large blocks of data. Data mining can be used in a variety of cases, some of them are algae bloom prediction, detection of fraud, risk management, filtering of spam emails, and discerning the emotion or user sentiment towards a topic.
The process of data mining can be divided in to five steps:
- Collection of data and loading it in warehouses
- Managing and storing the data in either servers or the cloud
- Accessing the data and organising it
- Sorting the data based on user preference
- Presenting the data
The process starts off with the collection of data. Data collected can be loaded into the warehouses maintained by the companies. The collected data is managed and stored either in the company’s servers or the cloud they have access to. The analysts, information technology professionals, or the management team then access the data and organize it according to their needs. The software application then sorts the data according to the results given by the user. The end result is the data presented either as graphs or tables. The process is shown in Fig.1.
Fig.1: Process of data mining
Algae bloom prediction can be done using data mining. Algae is a large group of an aquatic plant species that are non-flowering and lack roots, eaves, stems, and vascular tissues but contain chlorophyl. Algae bloom is the rapid growth of algae in freshwater bodies or marine water bodies. The water bodies that are contaminated with algal blooms are often discoloured. Algae bloom in water bodies are the result of fertilizer run-offs(like nitrogen or phosphorous). The effects of algae bloom on the water bodies are very disastrous. The effects range from feeding off of the higher level trophic levels to blocking the entry of sunlight into the water body, thereby affecting the other organisms in the water body. Some algae even release toxic substances into the water contaminating the water body further.
The process of over supplying the algae with nutrients and thus causing oxygen depletion in the water body is called Eutrophication. The dangerous effects of algal bloom are depletion of oxygen, blocking of sunlight, death of other organisms(like fishes) in the water. Algae infected water cannot be used which can lead to water scarcity if the water body is a source of water used for supply in cities. Therefore, the detection of algae bloom is very important for its early prevention. Data mining can be used to predict harmful algal blooms for its prevention and treatment.
The process is started by gathering the data about the water body under inspection. The data contains fields like season, size of the water body, speed of spread, maximum pH value of the water body, the different nutrients present in the water and the previous instances of algal bloom. The data is processed to remove unwanted information and is stored in the cloud. The data is retrieved for inspection and pattern matching. Patterns like higher nutrient concentration of nitrogen or phosphorus is checked. Patterns of previous infections are also analysed to see which factors affected the bloom of the algae and the type of algae that might infect the water body is checked. The end result is in the form of the graph presented in Fig.2.
Fig.2: Algae bloom prediction
The graph plots the density of algae bloom with respect to the nutrient(NH4) saturation in the water body. The increase of nitrogen nutrient in the water body is the cause of one type of harmful algae bloom. A controlled/normal level of nitrogen produces small amounts of algae which is not very harmful, but when the level of nitrogen increases in the water due to reasons like waste deposition, chemical release into the water body, and so on, the density of algae formation increases. The algae blooms spread throughout the surface of the water body while floating on the water surface and blocks the penetration of sunlight. By calculating the nutrient levels of the water bodies and cleaning them at regular intervals harmful algae blooms can be prevented.
Predicting sales of a store can also be performed with the help of data mining. Taking the sales data from various stores in a region, we can form a dataset to identify various details like the highest selling item in a store as shown in Fig.3, total sales of a category of the store as shown in Fig.4. The data collected can be stored in either the cloud or on-site servers. The dataset for this example is taken from-(https://www.kaggle.com/c/competitive-data-science-predict-future-sales/data?select=sales_train.csv). The data is then extracted to be processed. Data processing is important as there will be many fields that have either null values or fields which are not applicable to the predictions. Such fields when removed will yield better results with more accuracy. The next step after data processing is data mining to find patterns within the data to indicate the highest sales of either the item in one store or the overall profit of all the stores in the region.
Fig.3: Highest selling item in a store
The graph in Fig.3 shows the highest selling product in a store. The product/item id and the sales of the particular item are taken as the variables to plot the graph. The highest selling product in a store adds to the total profit obtained by the store in a significant manner. The item id which is selling the highest in the store is 20949 according to the graph selling over 15000 in quantity. Highest sales of a single product can only contribute to the overall sales profit of the store. Analysing this the stores need to promote and advertise the other products in the store to gain higher profits rather than relying on one single product. Offering various sales and discounts on the rest of the products will boost sales of the other items.
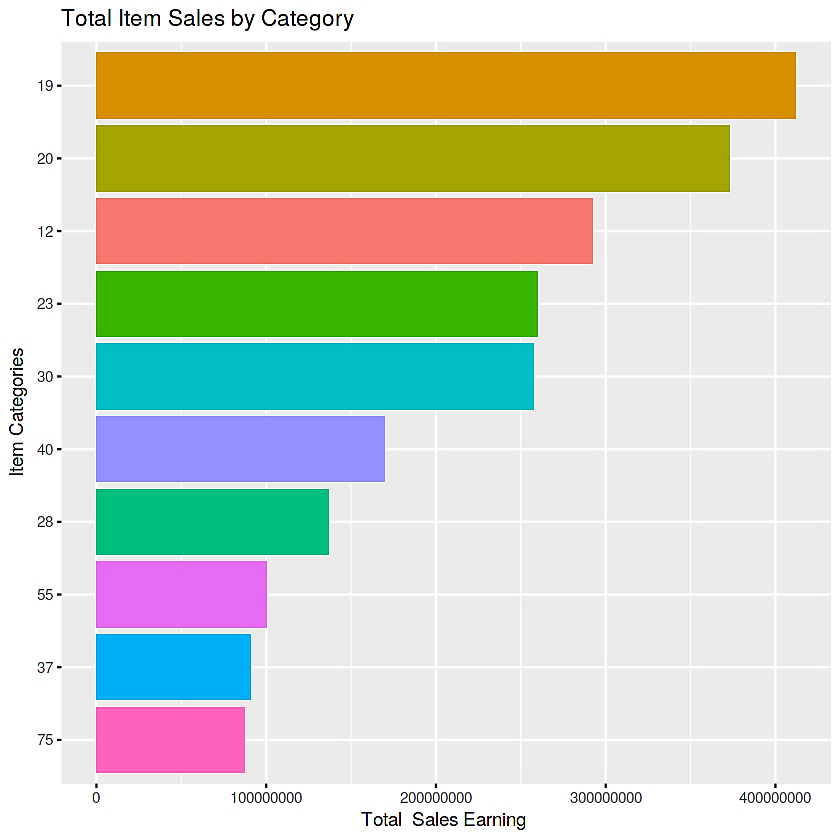
Fig.4: Total sales by category
In Fig.4, the total sales of the store by category are depicted. There will be many categories of products in a store like food, clothing, home accessories, and so. Many categories thrive all year round like food and clothing, and many categories lack high profits in sales like home accessories. The categories depend on the items being sold in them, like if clothing category sells seasonal clothes it will have high profits rather than selling the same clothes all year round. The top selling categories provide a high margin of profit to the overall sales of the store, as the category has many products it can contribute with high selling items. To increase sales in all the lagging categories, stores have to offer items that are trending in the market, in that season, at affordable prices. Occasional sales and discounts also add to attracting customers to the stores.