

Car Analysis
Cars Analysis
Dataset: The data for 32 cars is collected where each car’s specifications are shown in the dataset. The parameters mileage per gallon, number of cylinders, number of carburetors, number of gears, weight, automatic/manual, displacement, horse power and quarter mile.
- Exploratory Data Analysis:
- Univariate Analysis: All variables in cars data are analyzed:
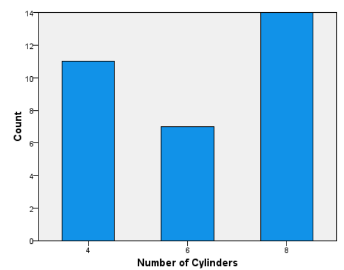
Interpretation: Analyzing the number of cylinders, maximum count of cars i.e. 14 have 8 cylinders, 11 cars have 4 cylinders and 0nly 7 cars have 6 cylinders. This indicates that large number of cylinders are favored by consumers. More the number of cylinders, higher the power of engine. Therefore, more engine power is preferred by customers.
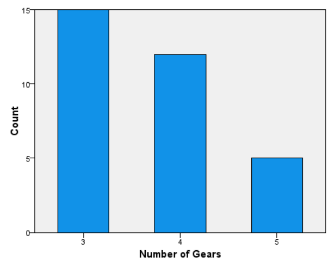
Similarly, among all 32 cars, 15 cars have 3 gears, 12 cars have 4 cylinders and least (5) cars have 5 cylinders. It indicates that less number of gears are preferred which makes the driving comfortable.
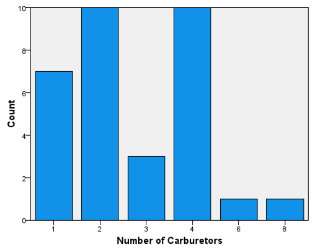
When analyzing the number of carburetors, most people (10) prefer either 2 or 4 number of carburetors whereas higher number of carburetors i.e. 6 and 8 are least preferred.
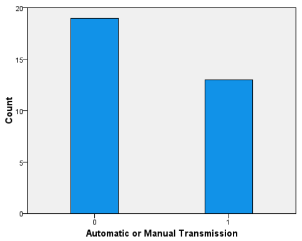
While considering the automatic or manual type of cars, 18 cars have automatic transmission and 13 cars have manual transmission indicating the higher preference for automatic cars.
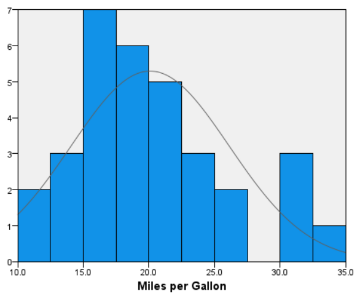
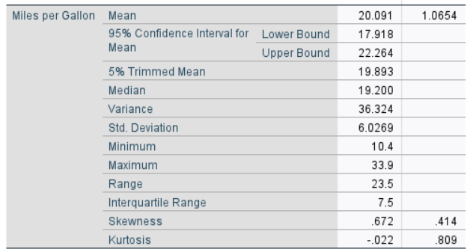
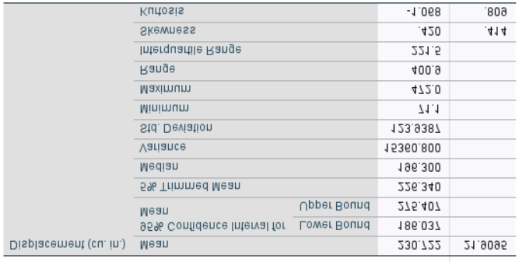
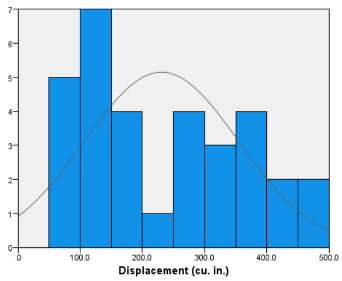
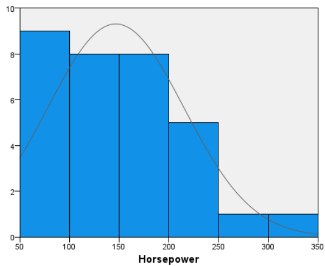
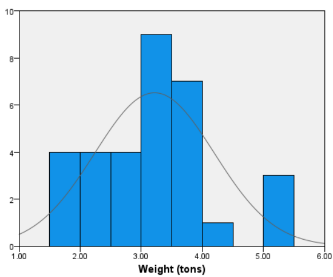


Interpretation: Milealge per gallon follows normal distribution ranging from 10.4 to 33.9. The mean value is 20.1, most cars are clustered around mean having 20.1 mpg. Horse power is a right skewed distribution as mean > median and is varying between 52 and 335. It indiacates that most values are clustered towards the mean but due to presence of extreme values the distribution is right skewed i.e. most cars have horse power on 146.7. The displacement variable has less difference in mean and median indicating the normal distribution which means that most cars have 230.7 cu in of displacement. The weight and quarter mile graph follows a normal distribution which shows that most cars are clustered around mean i.e. have weight of 3.22 tons and quarter mile of 17.8 seconds.
- Bivariate Analysis:
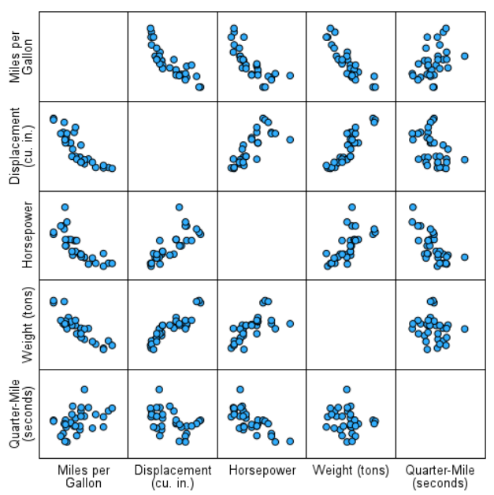
Interpretation: The scatterplot of all variables shows that there exists a strong negative relationship between miles per gallon vs displacement, horsepower and weight. It indicates that with the increase in value of one variable (displacement, horse-power and weight), the value of other variable decreases. The relationship between variables displacement-horse power; weight-horse power and displacement-horse power is positive indicating that with the increase in one variable, the value of other variable also increases.
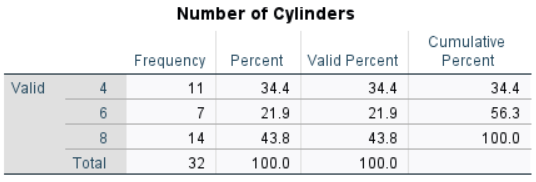
Interpretation: 43% of cars in data has 8 cylinders, 34.4% of cars have 4 cylinders and only 22% of cars has 6 cylinders indicating that mostly cars have either highest (8) no. of cylinders or least (4) no. of cylinders.
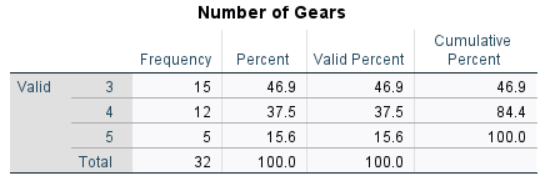
Interpretation: 47% of cars in data has only 3 gears, 37.5% of cars have 4 gears and only 15.6% of cars has 5 gears indicating that lesser number of gears are preferred.
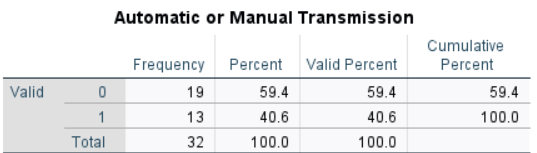
Interpretation: 60% of cars in data has Automatic transmission and 40.6% of cars have Manual transmission indicating that automatic cars are preferred over manual cars.
Interpretation: 31.3% of cars in data has 2 or 4 carburetors and 22% of cars have 1 carburetor and only 3.1% of cars has 6 or 8 carburetors indicating that mostly cars have either 2 or 4 carburetors which improves the engine power but engine power higher than it, is least preferred by the customers.
Hierarchical Clustering
Interpretation: A dendrogram is a tree-like structure that explains the relationship between all the data points in the system. The dendrogram shows clusters of vehicles with similar characteristics. Eg. Mazda RX4, Mazda RX4 Wag, Merc 280, Merc 280c has similar characteristics, forming a single cluster. Majorly, there are two clusters where one group is from Mazda RX4 to Honda Civic and another cluster is from Hornet 4 Drive to Maserati Bora.
Similarly, Fiat 128, FiatX1-9, Toyota Corolla and Honda Civic forms another cluster with similar features. All of them have 4 number of cylinders, lower engine power in the range of 52 to 66. All cars in the cluster are manual with 4 gears and less (1 or 2) number of carburetors.
Another cluster of Duster 360, Camor Z28 and Ford Pantera L have lower mileage per gallon, having 8 cylinders, displacement in high range indicating high power. The cars in this cluster has higher engine capacity of 245 or 264 hp.
Regression Analysis
Dependent variable: Miles per gallon
In regression output, the p-value for the F-statistic, which tests the overall significance of the regression model, is shown as 0.001 in the ANOVA table. The p-value is less than 0.05 indicating that the model as a whole explains a significant amount of variance in the dependent variable, meaning the independent variables collectively have a meaningful effect.
Interpretation: As our model has many independent variables, therefore adjusted R-square is considered to assess the model accuracy. Adjusted R-squared adjusts the standard R-squared by penalizing the inclusion of additional predictors that don't improve the model's fit. The value of adjusted R2 of 0.82 indicates that 82% of variance in dependent variable (mileage per gallon) is explained by the independent variables. This states that regression model fits the data well.
In the coefficients table, the significance column consists of the p-value for each independent variable in the model. It is concluded hat only weight variable has p-value of 0.04 which is < 0.05, indicating that the weight has significant relationship with dependent variable (miles per gallon)
The vale of beta coefficient of independent variables shows the strength of relationship between dependent variable (mpg) and independent variable. Here, weight has highest strength of -0.63 indicating the strong relation ship between weight and mpg. However –ve sign indicates that as weight decreases, the mpg increases.