

Business Intelligence-1
Business Intelligence & Insights
Business intelligence can be defined as a data driven solution provided by an expert business team which includes the insights on sales and marketing data, prediction on the sales or another aspect of the business organization, or the profit making analysis of the given data.
There are various business tools that project and general managers along with the sales department of an organization to provide insights on business or products or the on the areas that needs to be concentrated or on the areas that needs to be improvised or dropped for the business to move on in a smooth way.
The common business tools in this process used are:
1.SAP business Intelligence
2.Microstrategy
3.Data Pine
4.SAS business Intelligence
5.Microsoft Power BI
And many more.
The Business intelligence tools are as well used in Cloud Systems and are also can be implemented through Programming using various Programming Languages such as Python.
Python’s matplotlib Library and the Seaborn library are one of the best libraries which are used in data visualization. Experts good in programming usually use the Python as their tool to asses the given data of any business organization.
The data that I have chosen here is from Kaggle.it is a Super market dataset.
The link for the dataset is as given below:
https://www.kaggle.com/aungpyaeap/supermarket-sales
the dataset Metadata which was attached with the data set is as follows:
Description
Context
The growth of supermarkets in most populated cities are increasing and market competitions are also high. The dataset is one of the historical sales of supermarket company which has recorded in 3 different branches for 3 months data. Predictive data analytics methods are easy to apply with this dataset.
Attribute information
Invoice id: Computer generated sales slip invoice identification number
Branch: Branch of supercenter (3 branches are available identified by A, B and C).
City: Location of supercenters
Customer type: Type of customers, recorded by Members for customers using member card and Normal for without member card.
Gender: Gender type of customer
Product line: General item categorization groups - Electronic accessories, Fashion accessories, Food and beverages, Health and beauty, Home and lifestyle, Sports and travel
Unit price: Price of each product in $
Quantity: Number of products purchased by customer
Tax: 5% tax fee for customer buying
Total: Total price including tax
Date: Date of purchase (Record available from January 2019 to March 2019)
Time: Purchase time (10am to 9pm)
Payment: Payment used by customer for purchase (3 methods are available – Cash, Credit card and Ewallet)
COGS: Cost of goods sold
Gross margin percentage: Gross margin percentage
Gross income: Gross income
Rating: Customer stratification rating on their overall shopping experience (On a scale of 1 to 10)
The Analysis on this dataset showed the Following insights:
1.Analysis was done how many People are Customer Types of Members and Non Members:
The Following Results were obtained:
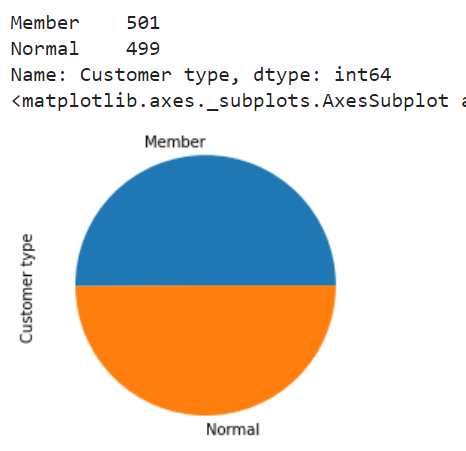
So there were Equal Number of Member Customers than the Non Members
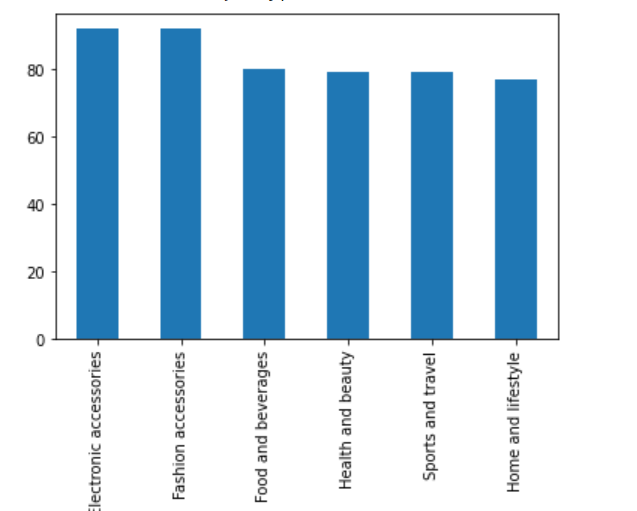
2.Analysis on what type of products Non Member Customers was done and the results are as follows:
3.Member Customers also bought products in the following manner:
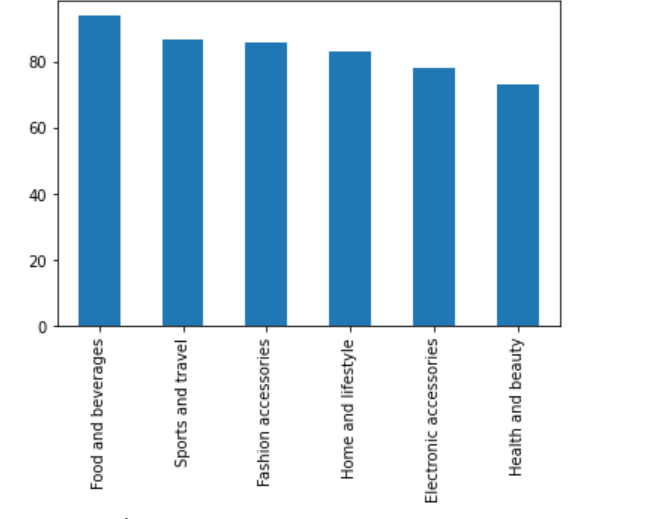
Here the Members also show similar types of behaviors as that of the Non Members. Only Difference is the number of people purchasing the health and beauty products are more.
The Preference of Member Customers is more in buying the Electronic accessories and the preferences of Non Members is mostly on Food and Beverages.
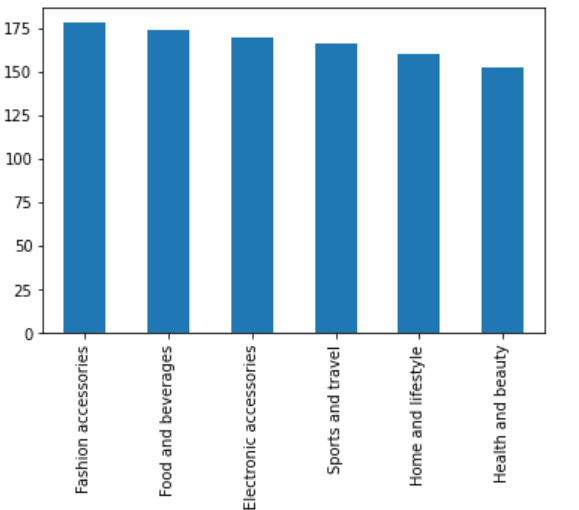
4.Now Let us analyse how many people in total regardless of members or non members purchase various products
The total number of Sale invoice recorded in the following is 1000
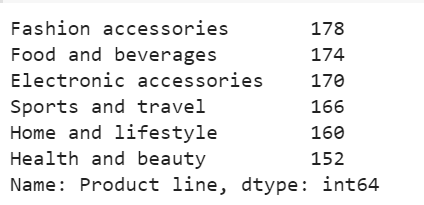
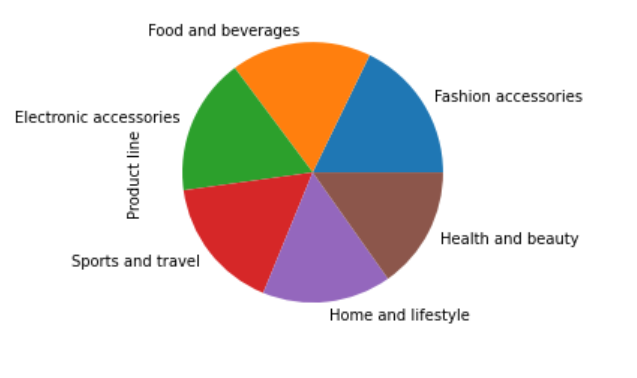
Hence the customer being a member or a Non member has not affected the has not affected much in the product purchase as the products are bought equally.
But the Popularity of the product bought is important
5. Now Let us Analyse the Spending Pattern of Members and NonMembers
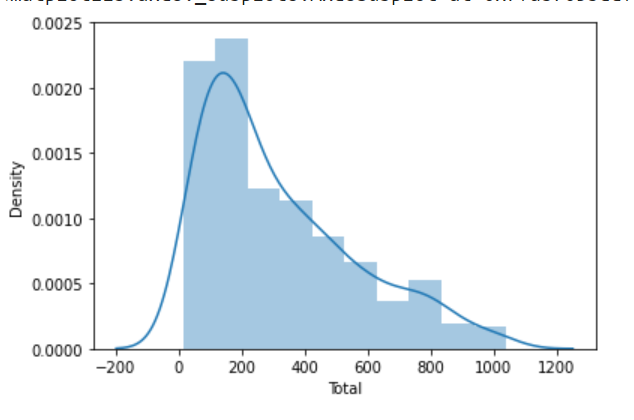
The Above is for NON members
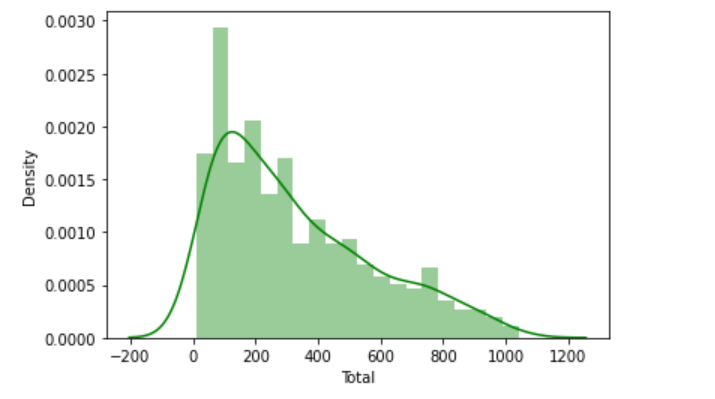
The Above is the Graph of Members
We can Observe that Non Members spend very less in the range of 800 to 1000
Where as there are many members who spend in that range
Increasing the Way the Members Spend in this range can have effect on Profit.
6.Analysis of Effect of Unit Price on the Total amount spent
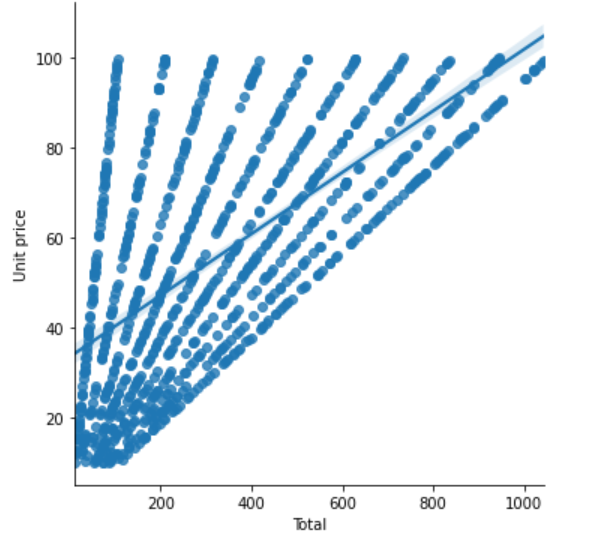
The Above plot shows that there is a linearity is Total Spend by customers with the unit price.
Hence Unit price can only be increased but not decreased. But Increase in unit price may not attract many customers. Hence ,Best option is to provide offers to customers and where the Unit price is too high and increasing the low priced items can balance the Income.
7. Some times giving Discounts on the Products can increase the Quantity Purchased and hence the Total Spend as well
This can be shown by the following graph:
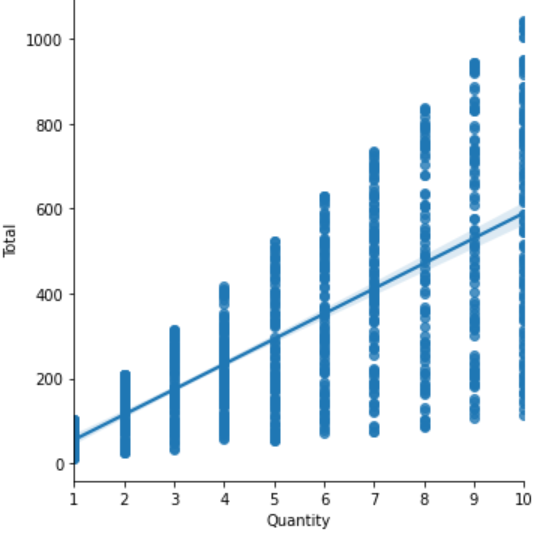
So Quantity has Linear positive Relationship with the Total.
On a whole Increasing the member privileges can benefit the Sales.
8.The Gross Income from various customers is as obtained:
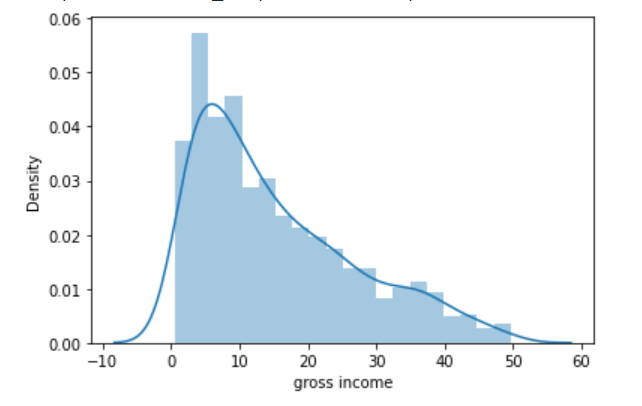
A maximum gross income is obtained as per the graph from 1 to 15.
Hence it is a good range but needs to be targeted for changes in sales in a positive manner.
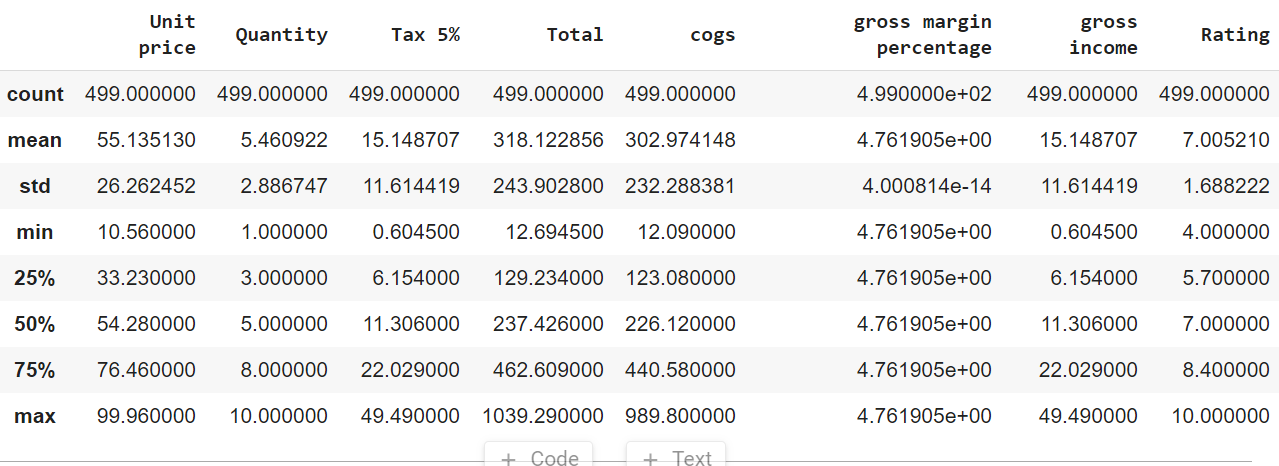
9.With respect to the Numerical Values from member data and the Non Member Data:
Nonmembers:
Members:
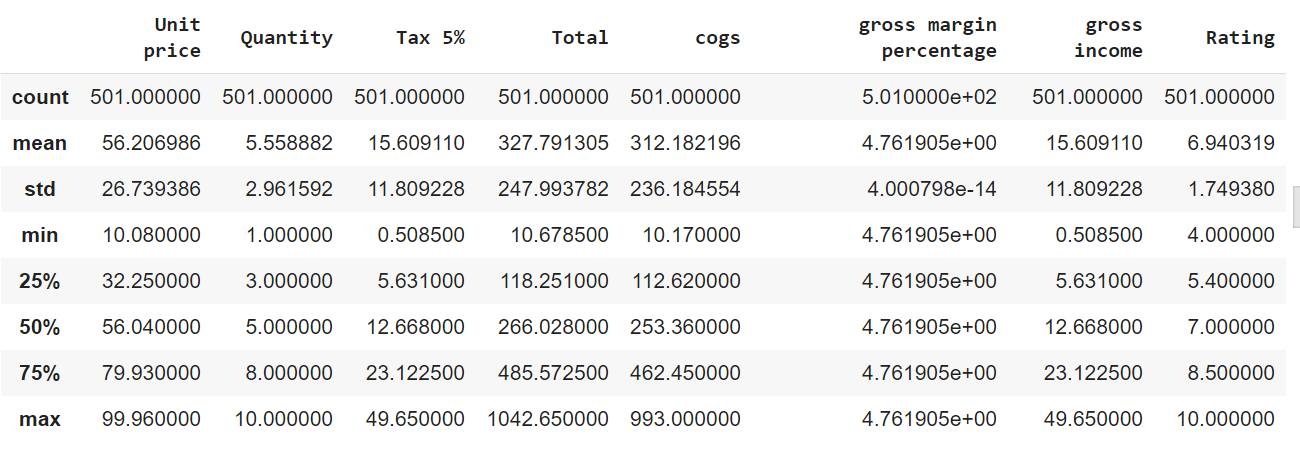
The Following Conclusions are Obtained:
- COGS is found to be slightly more for members than Non-Members
- Tax Amounts obtained from Members is also high
- But Rating of Experience with Members is not so good as that of Non-Members
- Total Spend is Also High
- Hence Concentration on Experience of Members Must be Given and Concentration on Converting Non-Members to Members must be Targeted
- Gross Marginal Percentage is not affected by the Membership
- COGS is High in Members but on the other side Gross Marginal percentage is also high in Members
Hence increasing the Number of Members have good Benefits.
10.Now Analysis must be made on the Mode of Payments the Members and the Non-Members Use
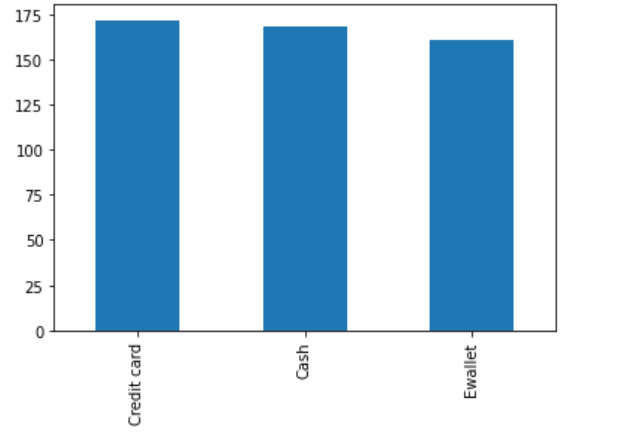
The Above is of Members. Members are found to use a Credit Card than the E wallets.
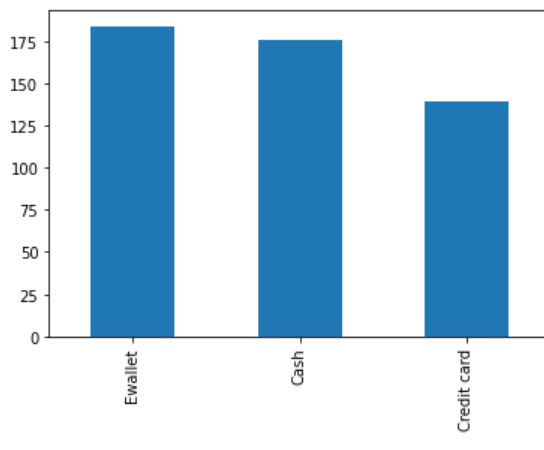
The Above graph is of the Nonmembers. They Use a lot of EWallets.
The Special offers on E-Wallets can be given to members as well to ease the Conversion of Members to non members.Members become our Frequent Customers due to the Privileges given and hence Benefits do increase
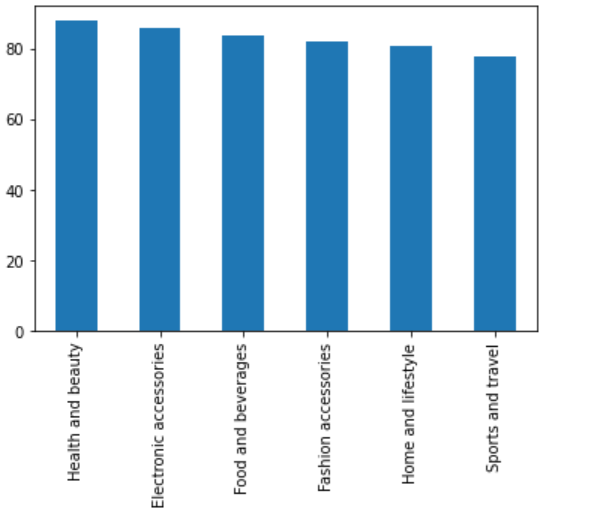
11.Now let us analyse how is purchase of men going on in the market
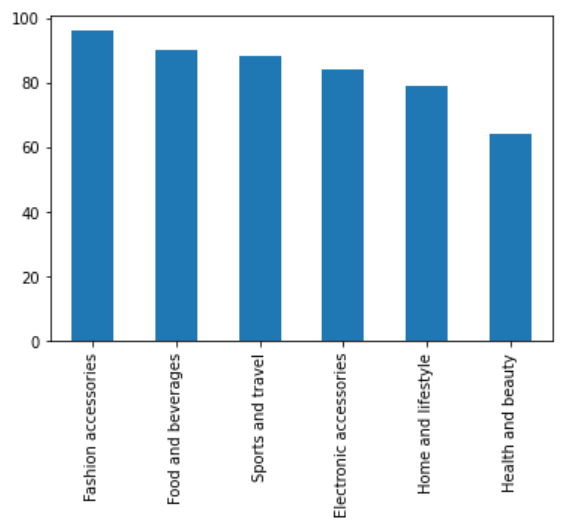
12. Analysis on Women going to market:
The data of Various Products have been Collected as Following Described below:
The Unit Prices have been found to have Profound effect on Total Spend.
The Unit Prices as shown above have been high for Fashion Accessories and less for Health and beaty.
From the above graphs :
1.Men are found more to shop on health and beauty products and Women are found more to shop on Fashion accessories.
- So from above descriptions increasing sales for Fashion accessories for women
- and increasing health and beauty sales for Men will gain profit, provided there should also be an increase in unit prices.
- and increasing food sales in both of quantities in large amounts with offers will increase customer experience
- both male and female experience standards must be concentrated
- the target on Nonmembers becoming members should be concentrated
- especially among male
- and sale among women must be calculated to get good profit
The python notebook for the following data can be seen at
https://colab.research.google.com/drive/1Wv7cPTnvdskRtrXVmH1YTyfCs-5jwTQ-?usp=sharing